
On 6 January 2024 I ran the Florijn Winterloop in Leusden, 10 English Miles, 57:08 on the chip. I was 46. It is still the best age grade I have ever run — better than any of my marathons.
It scores 82.50%.
It also scores 83.09%. And 83.33%. Same race, same time, same birthday. Three published editions of the same set of tables, three answers, and no arithmetic error anywhere.
Three calculators, three numbers, one race
Here is my Winterloop through every edition of the Alan Jones road tables still in circulation.
| Edition | 10-mile open standard | M46 factor | My age grade | Open-class equivalent |
|---|---|---|---|---|
| Alan Jones 2015 | 44:00 | 0.9242 | 83.33% | 52:48 |
| Alan Jones 2020 | 43:45 | 0.9216 | 83.09% | 52:39 |
| Alan Jones 2025 | 43:15 | 0.9176 | 82.50% | 52:26 |
Those are computed from the published 2015, 2020 and 2025 spreadsheets in Alan Jones's own repository, not from three websites I happened to try. Every row is internally correct. 57:08 never moved.
So if you cross-checked two calculators and got two numbers, you did not make a mistake and neither did the calculators. The tools genuinely disagree, and the disagreement is old, documented and mostly boring. It's worth taking seriously before resolving it, because the reflex — one of these sites must be broken — sends people looking for a bug that isn't there.
There are three real mechanisms. Here they are, biggest first.
Which edition is your calculator running?
Reason one, and the biggest: seven age-grading calculators are live on Howard Grubb's site alone, from WAVA 1994 to the 2025 road tables (Howard Grubb, Athletics Performance). Most disagreements are one edition apart. The road tables get revised every five to ten years, each revision is approved and published, and the old ones never go away — they stay online, indexed, bookmarked and embedded in results software.
Grubb hosts the calculators most of the running world actually uses. The seven are WAVA 1994, WMA 2006/2010, the 2010/2015 lookup, walks 2020, track 2014, track 2023 and road 2025. The 2020 road calculator is still live too, one link further out (MLDR road 2020). They all work. They all give different answers. The newest road version is MLDR road 2025, but the page most often linked from elsewhere on the web is the 2015 lookup, because it has had a decade longer to collect links.
That's not sloppiness on his part. It's an archive doing what an archive does. But it means "the Alan Jones calculator" is not one thing, and two runners can both use it and disagree.
The same split runs through everything else. Marathon Handbook's calculator states it uses "2020 age-graded and world-record data published by Alan Jones" (Marathon Handbook). Runbundle says it uses "the 2025 tables maintained by Alan Jones" (runbundle). RunDida quotes the 2025 road standards outright, down to the 2:00:35 marathon (RunDida). Two of those three are current. One is a revision behind. None of them is wrong.
Why do track factors break a road result?
Reason two is rarer and hits harder. An 18:00 5K run by a 46-year-old man reads 78.63% on the Alan Jones 2025 road tables and 75.87% on WMA 2023 track factors for 5000m — 2.8 points, from nothing but the wrong table family.
I can put that size on it because RaceRecords ships both table families and I can run the same time through each. The road side: open standard 12:49, M46 factor 0.9055. The track side: standard 12:35.36, factor 0.9219. Same eighteen minutes either way.
Road running and track running have separate tables, and they are separate on purpose — a track is flat, accurately measured, paced and sheltered, and the times reflect it. Grade a road race with track factors and you get a systematically harsh number.
Some calculators are explicit about the split. RunDida separates the 2025 road revision from the 2023 track one in its own copy. Others aren't. Runningfastr credits "the tables maintained by Alan Jones" and never names a year or a surface at all (runningfastr) — so if its number disagrees with yours, there is no way to find out why.
What happens when the world record moves?
Reason three sits underneath the first. My ten-mile open standard has gone 44:00 → 43:45 → 43:15 across the three editions, and each drop makes the same run score a little lower. An age-graded percentage is a ratio, and that standard is the bottom of it — roughly, what the world's best can do at your distance.
So that's the whole story of my ten-miler. Nobody rescored my ageing curve. The M46 factor drifted from 0.9242 to 0.9176, worth about a tenth of a point. The rest is the ceiling rising.
I wrote this one up in full after New York, where the same 2:56:19 read 76.4% on the official results page and 74.9% here — a point and a half, all of it the marathon world record. The mechanism is identical at every distance. Only the size changes.
One honest wrinkle on my own example. Alan Jones develops standards directly for 5K, 10K, half marathon and marathon, then interpolates everything else — and the 2025 revision changed the interpolation scheme for exactly those in-between distances (Alan Jones, 2025 Files Readme, 2025). Ten miles is an interpolated distance. So my 0.83-point spread is a slightly messier number than a marathon spread would be. I'd rather say that than pretend the example is cleaner than it is.
So which number is right?
None of them, and that's the wrong question.
83.33% is a true statement about 57:08 measured against a 44:00 standard. 82.50% is a true statement about the same run measured against 43:15. Neither is a fact about me on its own. The pair — number plus edition — is the fact. A percentage with no edition attached is like a temperature with no scale.
So the useful question isn't which site is correct. It's: which of these tools tells you what it used? That's answerable. Open the calculator, look for a year and a surface. If you find them, you have a real number you can reconcile against any other real number. If you don't, you have a number you can never check.
That reframing costs the industry nothing and it's the only version of this that survives contact with the arithmetic. There is no committee that will declare one calculator canonical.
The largest distributor of age grades in the world doesn't name its table, and says so plainly on its own help page. That case is worth its own post — here's what your parkrun percentage is, and what it isn't.
What RaceRecords does about it
Three things, in the order I'd defend them.
One: consistency across your own history. Every road race you log is graded on Alan Jones 2025 — the one you ran last month and the one you ran in 2014. That's the point. If the tables drifted underneath your own history, a rising age-grade line could just be an old race sitting on a soft edition, and a falling one could be the tables tightening. You'd have no way to tell the difference between your trajectory and the tables' trajectory.
I'm careful to call this consistency and not accuracy. Accuracy invites "says who?" Consistency is arithmetic. You cannot compare two performances graded against two different standards, and that holds no matter whose tables you prefer.
Two: transparency. Every score carries the edition it was computed on, visibly, as a chip next to the percentage. Tap it and you get the plain-language note — which tables, why a race organiser's number may read a point or two higher, and a link through to how grading works. Edition changes are logged. Nothing about the number is meant to be taken on trust.
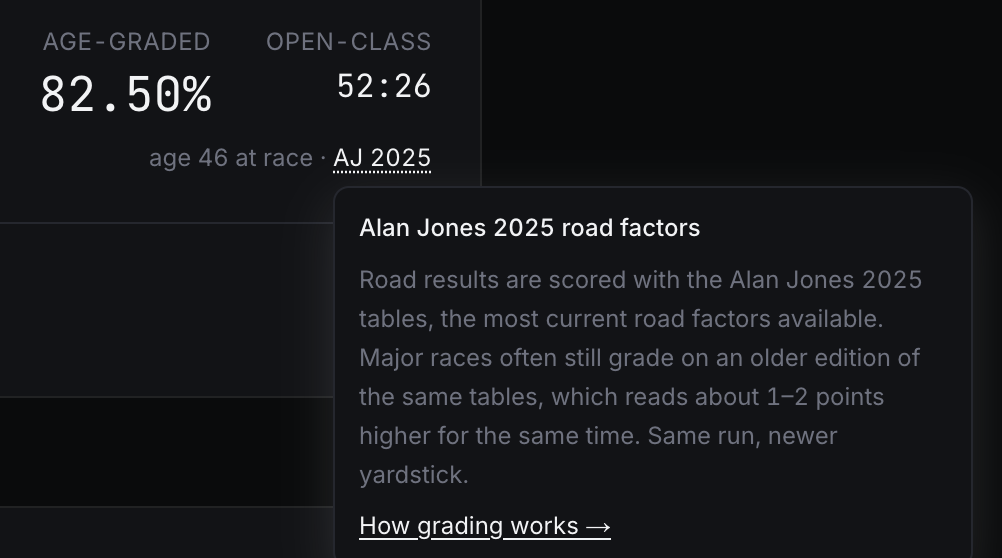
Three: currency. Alan Jones 2025 is the latest approved road edition, signed off on 10 January 2025 by USATF's Masters Long Distance Running Council. Latest, not best. It's the current edition of a living standard, and it will be superseded.
Why does an old race score lower here?
Grading everything on the current tables has a price, and it lands on old races.
My Winterloop was run in January 2024, when the 2020 tables were the approved edition. On the day, the number in circulation for that run was 83.09%. On RaceRecords it reads 82.50%. I re-scored my own best-ever race downward, in public, on my own site.
So an old race may score slightly differently here than it did on the day. That's real, and I'm not going to bury it. But the point was never to preserve the day's number — it's to let that race be compared to everything else I've run, on one standard. A frozen 83.09% would be a souvenir. It would also be uncomparable to every race I run from here on.
If you want the number your race gave you on the day, keep it. It isn't wrong. It just doesn't belong in the same column as the rest.
What happens when the next edition lands?
I don't know when the next road revision lands and I'm not going to invent a date. The pattern is roughly every five years, but that's a pattern, not a schedule.
What I can tell you is the direction. Editions tend to get tighter, for two compounding reasons. World bests fall, so the denominator shrinks. And the pool of masters performances the single-age bests are fitted to keeps deepening, so the curve gets pulled toward what the best masters athletes are actually doing. Both push scores down slightly. It has run the other way before — the 2010 revision existed partly because the women's tables at longer distances were judged too soft, with several runners scoring over 100% — but tightening is the norm, and age grading has never been the soft option.
So here's the promise, such as it is. When a new edition is approved, RaceRecords moves every result onto it at once. Your 2014 race and your 2027 race stay on one standard. Every score keeps showing which edition produced it. Edition changes go in the log.
A number that shifts should always have a visible reason. That's the entire commitment.
What the number is actually for
If you came here from a results page with two percentages and wanted me to tell you which one is real, I'm sorry — I've given you a third.
But the third one comes with its edition printed next to it, and so does every other race in your history. That's the only thing that makes an age grade useful. A single score is a fact about a table. A sequence of scores computed the same way is a fact about you.
Read the trend, not the second decimal. Ask what edition, not which website. And if you want to see what your own races look like on one standard, that's the whole reason this exists.
Either way, 57:08 is still 57:08.
Sources and what they said
Every claim about which edition a given calculator runs is perishable — that's rather the point of the post. Each one below was checked on the date shown, and any of them can move without notice.
- Alan Jones, Age-Grade Tables — the 2015, 2020 and 2025 road tables, the revision history, and the 10 January 2025 USATF Masters LDR approval. All figures in this post are computed from these files, not read off a calculator. Retrieved 2026-08-10. https://github.com/AlanLyttonJones/Age-Grade-Tables
- Alan Jones, 2025 Files Readme — the interpolation scheme for distances between 5K, 10K, half marathon and marathon, which is how the ten-mile standard is derived. Retrieved 2026-08-10. https://github.com/AlanLyttonJones/Age-Grade-Tables/blob/master/2025%20Files/Readme.txt
- Howard Grubb, Athletics Performance — the seven calculators, and the separate 2020 road page. Retrieved 2026-08-10. https://www.howardgrubb.co.uk/athletics/
- Marathon Handbook — "2020 age-graded and world-record data published by Alan Jones". Retrieved 2026-08-10. https://marathonhandbook.com/age-grade-calculator/
- runbundle — "the 2025 tables maintained by Alan Jones". Retrieved 2026-08-10. https://runbundle.com/tools/age-grading-calculator
- RunDida — 2025 road standards, quoted down to the 2:00:35 marathon. Retrieved 2026-08-10. https://rundida.com/tools/age-grading/
- runningfastr — "the tables maintained by Alan Jones", no year and no surface named. Retrieved 2026-08-10. https://www.runningfastr.com/age-grade-calculator/
The road-versus-track comparison uses the two factor tables RaceRecords itself ships, Alan Jones 2025 and WMA 2023. Both are described on the methodology page.